
Local government | urban greening | strategy implementation |
City of Gosnells | City of Belmont
Focus
While metrics of overall urban canopy are important for understanding the total extent of the urban forest, not all land is under local government control or influence. Assessing canopy cover across different land tenure categories – and specifically on land that councils own, manage or control, including local road reserves – provides a more accurate and practical foundation for urban greening efforts. This supports the setting of realistic goals, prioritisation of planting, and tracking of progress within areas where councils have the greatest capacity to act.
Recently planted trees may not yet be detectable or captured within remote-sensed canopy spatial layers, particularly during the first few years of establishment when canopy size is still small, and as a result may not be reflected in tree canopy cover mapping or associated urban forest statistics. Relying solely on current canopy data can therefore underestimate the contribution of recent planting programs and the future value of existing planting investments, while also limiting the ability to identify when and where canopy gains are likely to occur, or where canopy gaps may persist.
The City of Gosnells and City of Belmont sought to better understand their current canopy cover on land under their direct control, and to visualise their tree planting initiatives while estimating the additional canopy these planting efforts would likely to contribute to their urban forest and canopy cover targets over time. By moving beyond static canopy snapshots, this approach provides a forward-looking evidence base to help local governments understand how today’s planting decisions will shape their future urban canopy.
Refining the urban canopy calculation
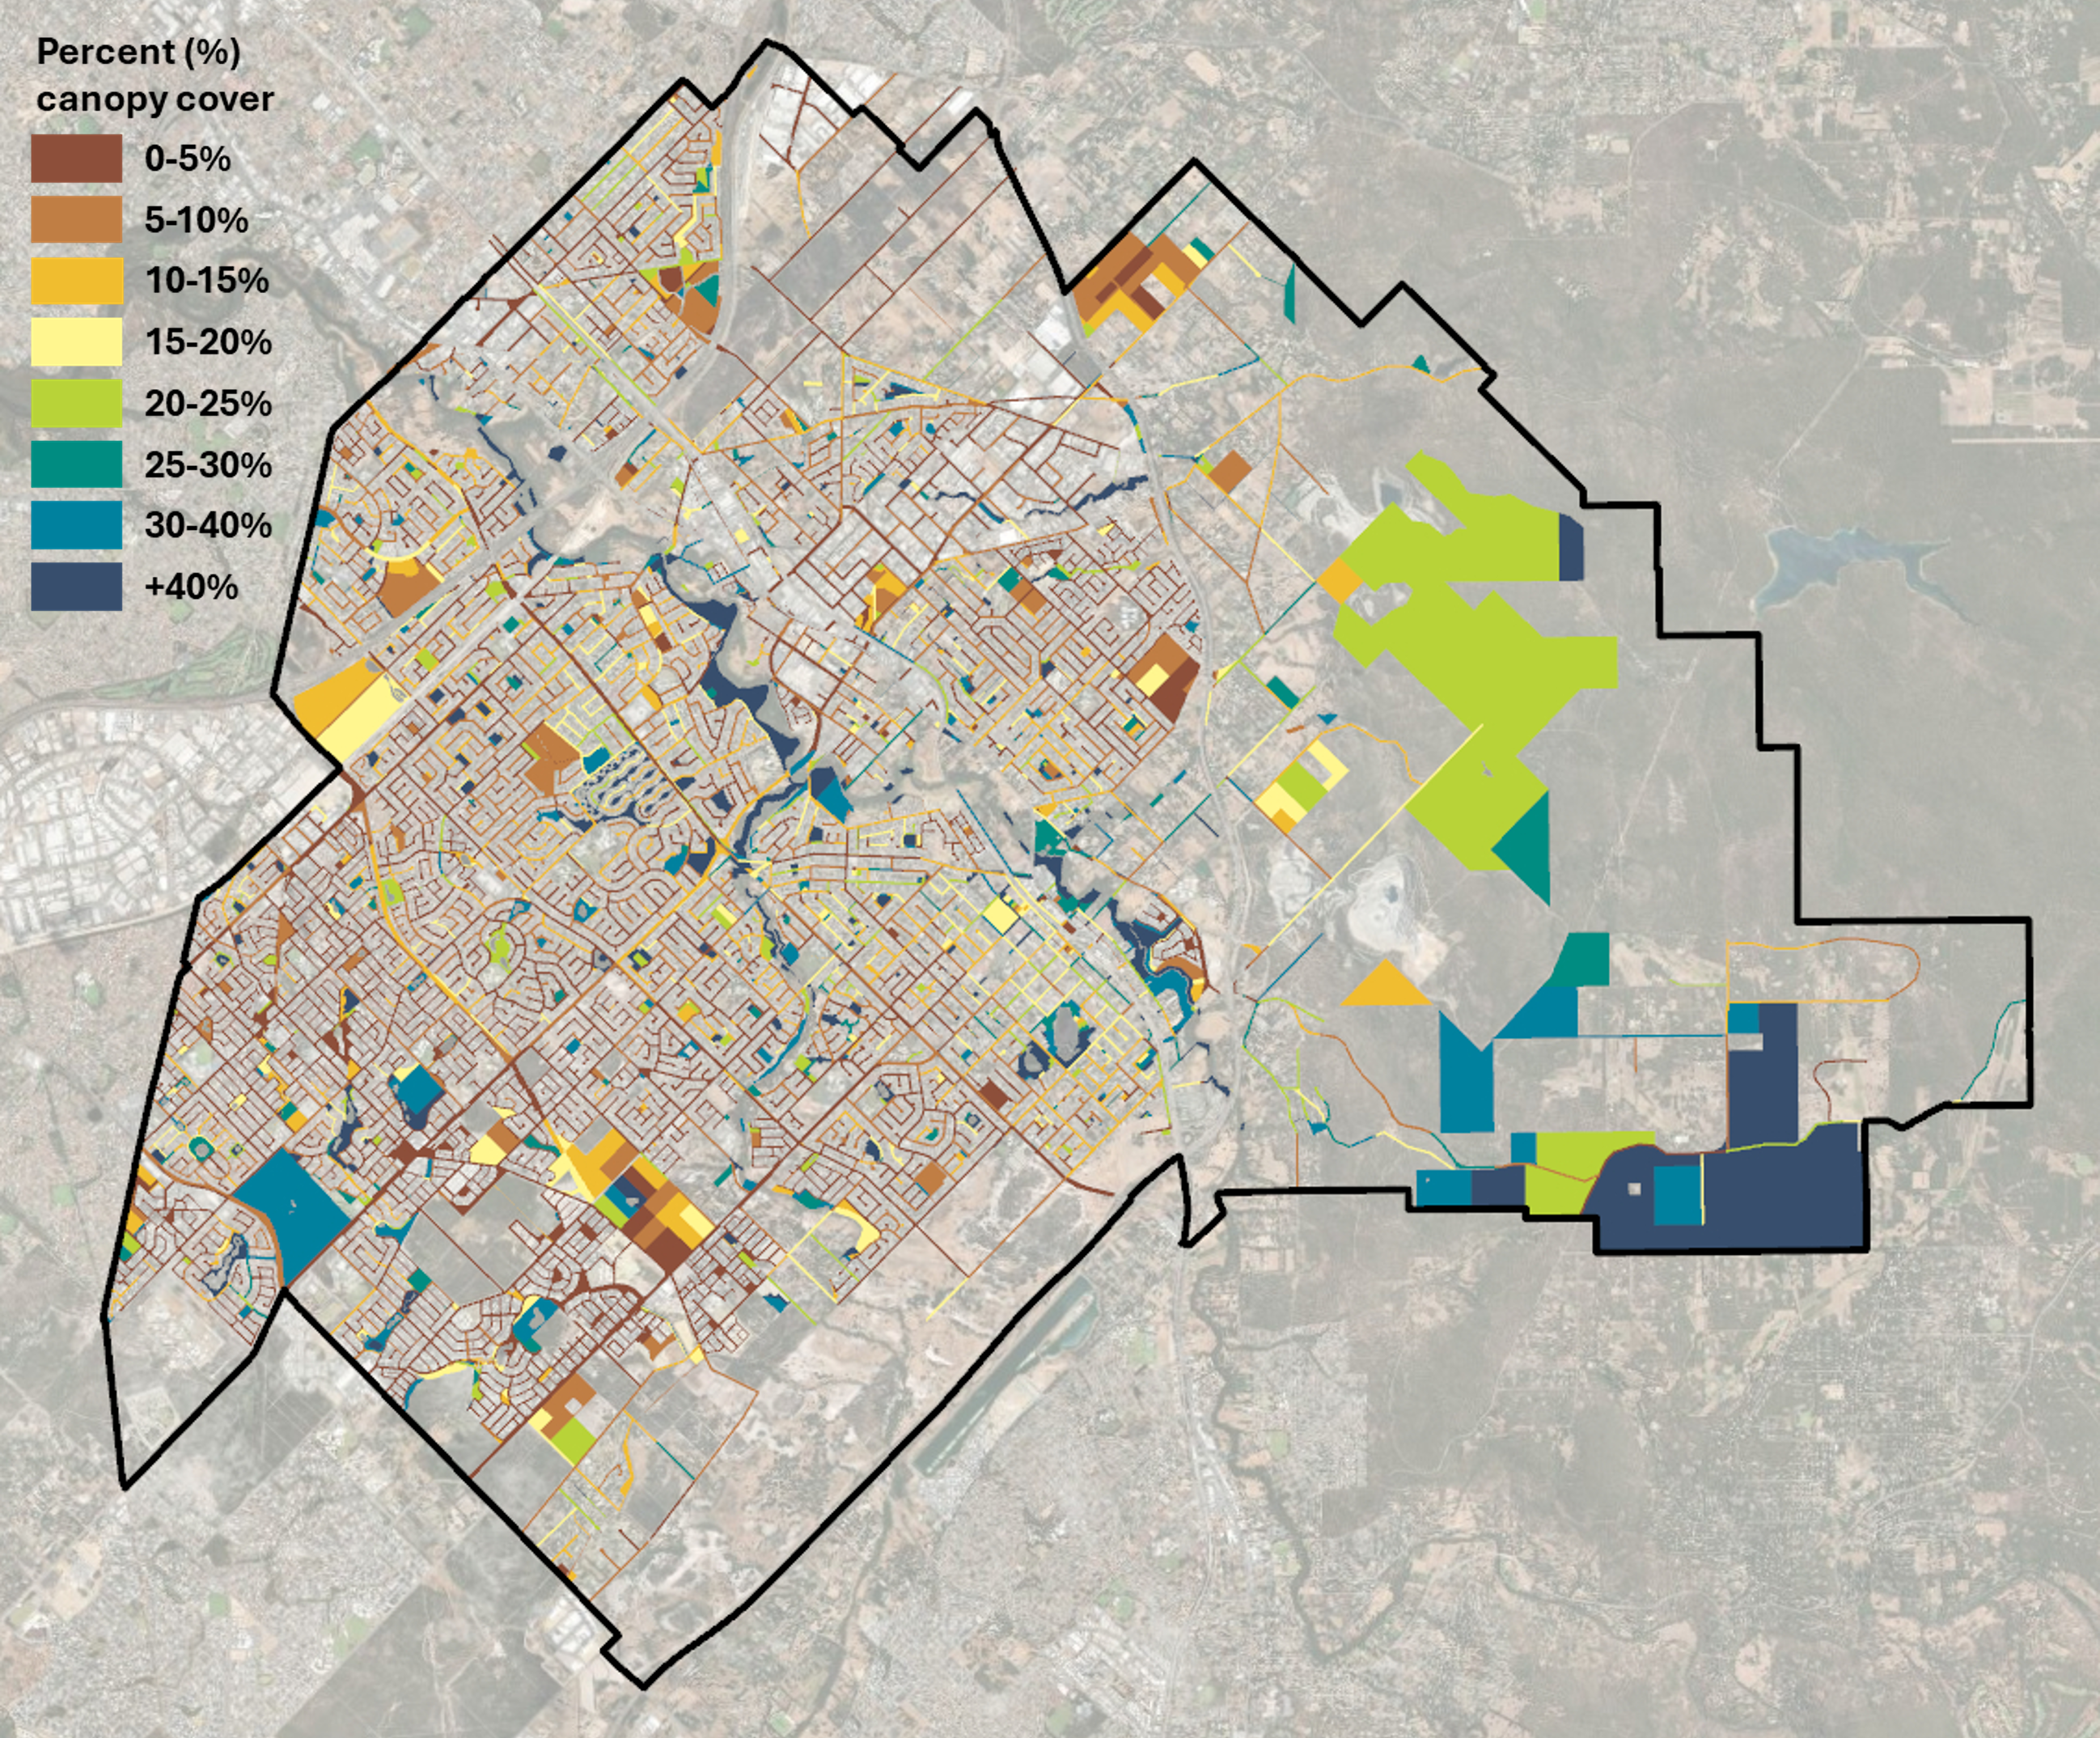
Using the DPLH Urban Forest (2024) parcel layer, with tree canopy cover area and percentage assigned to each parcel, as the base dataset, all land parcels were classified by their tenure (ownership) and land use (from Local Planning Scheme zones and reserves). Waterbodies were then removed from the land parcel layer to provide a more accurate land area denominator, and the percentage canopy cover for each parcel was recalculated.
The total land area excluding waterbodies, along with canopy cover area and percentage canopy cover, were then aggregated by land tenure and for all land parcels within local road reserves and those owned or managed by the local government, representing the land under the direct control of the local government.
Modelling tree canopy growth
To estimate the future canopy benefits of newly planted trees, the Thriving Perth Portal team compiled a database of species-specific growth rates based on the typical canopy size, time to maturity and lifespan of different tree species.
Using these species-specific growth rates, the canopy growth of each planted tree was projected over a 20-year period to 2040. Each tree’s expected canopy size was calculated based on its planting year and how old it would be by 2040. Once a tree reaches its expected maturity age, it is assumed to have reached its typical maximum canopy size, which is then maintained for the remainder of the modelling period.
For each year of the modelling period, and for the mature canopy scenario, buffers were generated around the tree planting points, with their size reflecting the estimated canopy area based on years since planting and species-specific growth rates. This provides a practical estimate of the additional canopy area the City’s planting programs are likely to deliver over time (assuming normal growth and survival).
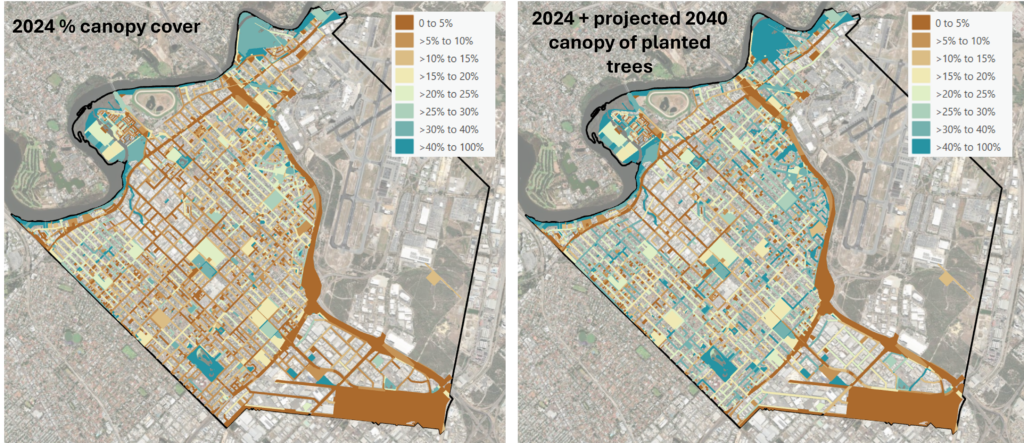
The resulting future canopy spatial layer illustrates where canopy gains are expected to occur and helps identify where canopy gaps or deficits may remain. This assists councils to recognise the future value of current planting investments, track progress toward canopy targets, and determine where further planting may still be needed.
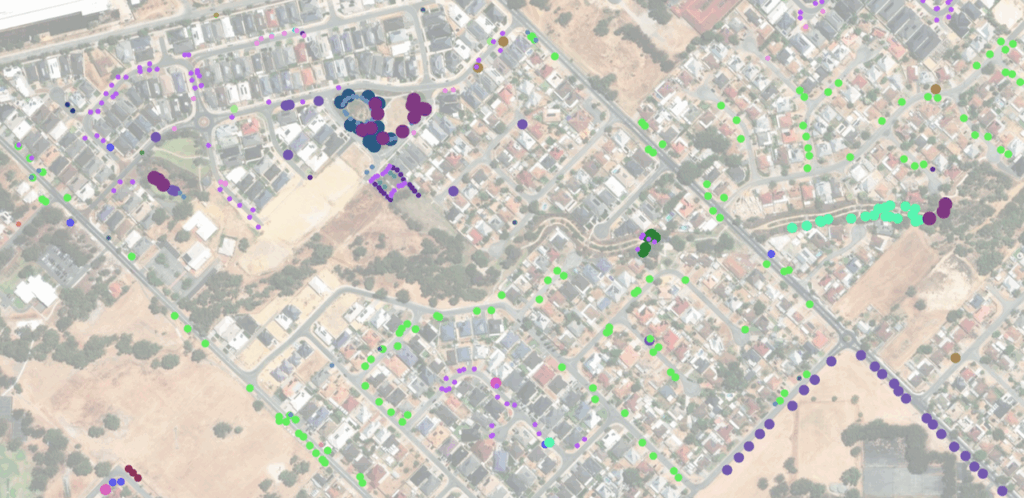
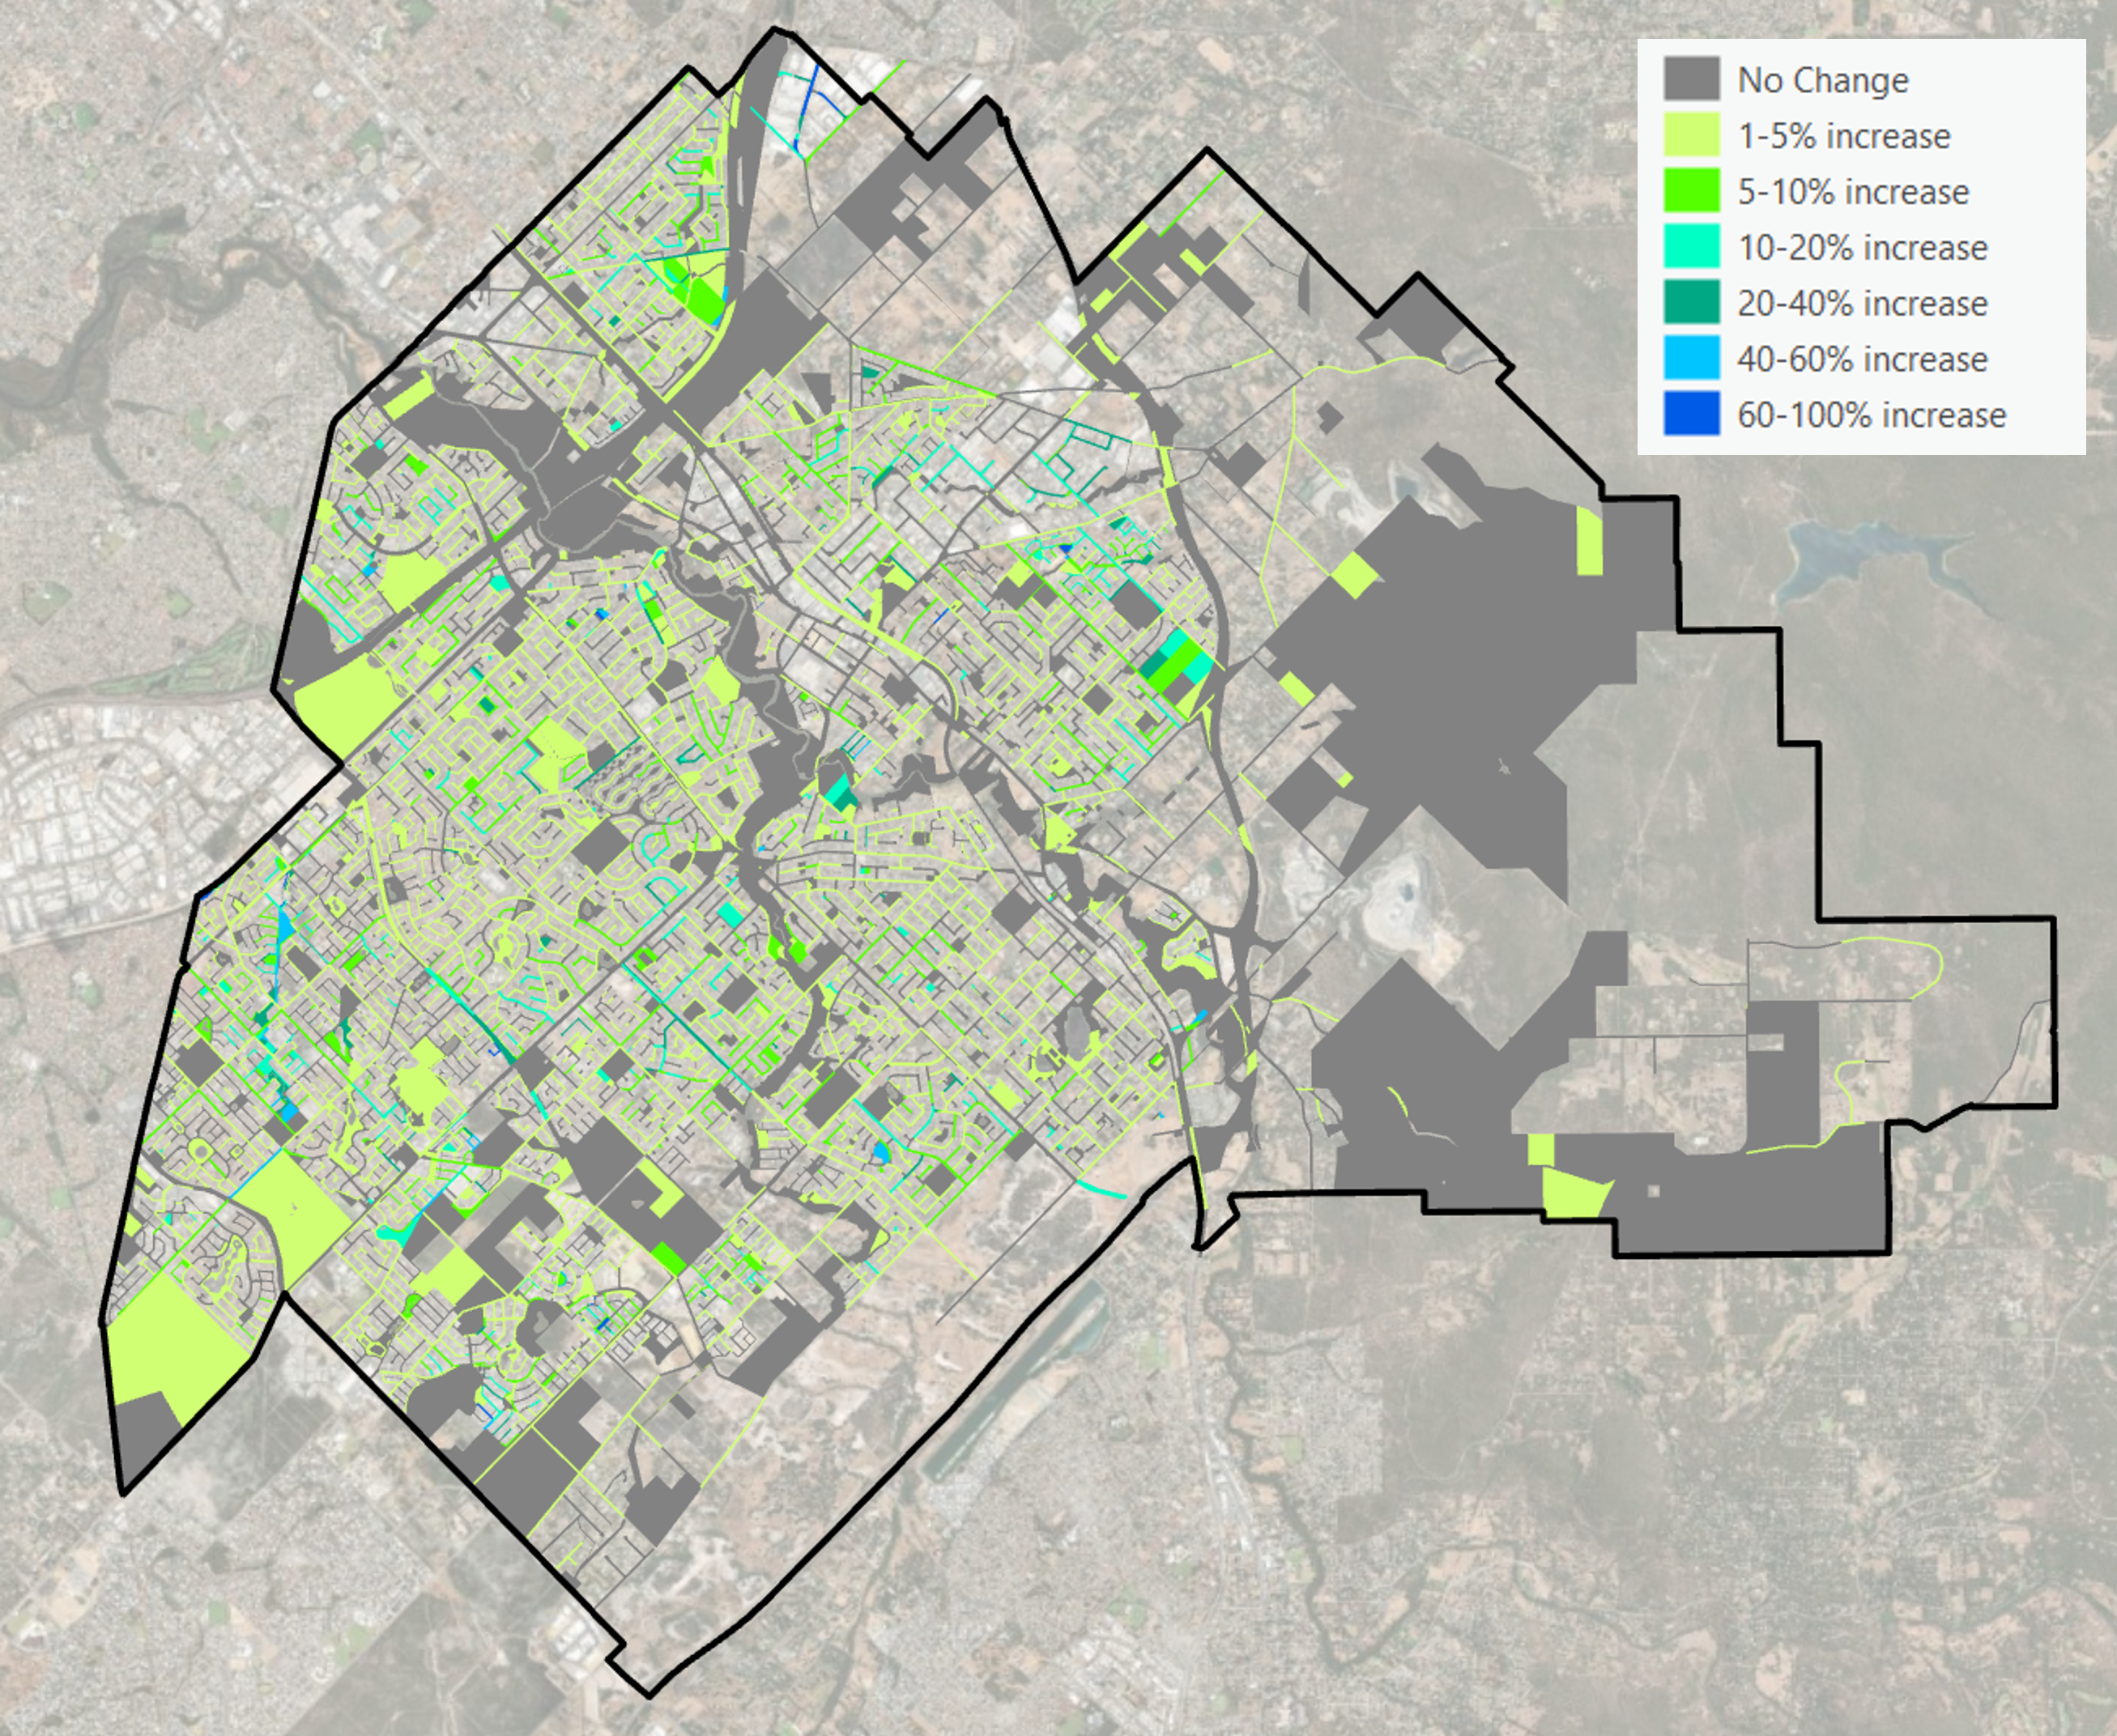
The planted tree points, together with their estimated future canopy area, were spatially joined to the corresponding land parcels on which they were planted. The projected total canopy cover from these planted trees was then calculated, and overall canopy cover percentages (current plus future canopy) were updated to reflect this additional contribution. Land parcels were also displayed by their potential change in canopy cover, clearly showing where tree planting initiatives have occurred and the likely magnitude of their impact.
How is the data being used?
The spatial layers and analytical approach have been developed and applied in partnership with City of Gosnells and City of Belmont. These councils are using the tool to guide the implementation of their urban greening strategies, strategically directing annual tree planting targets and allocations to locations where they can deliver the greatest overall benefit or specific benefits aligned with current council priorities.
Interested in running this analysis for your local government area?
If your local government would like to discuss using and applying the future canopy cover analysis, please get in touch. We would be happy to discuss how the tool can be tailored to your local priorities, datasets and strategic objectives to support evidence-based urban greening and annual tree planting programs.